What!
I first tried Sensu at my last job roughly 2 years ago and really enjoyed it. After years of various distributions of Nagios and occasionally trying alternatives such as Zabbix, Sensu came along and offered a fresh perspective.
After a couple of weeks running Sensu in parallel with Nagios I was convinced. It wasn’t until starting my current job that I really got my hands dirty with Sensu, this blog post is about what I’ve learnt over the last year.
Why Sensu?
I’ve been inspired by some great talks by people who are far better at explaining things than me, here are some of them:
Andy Sykes’ talk called Stop using Nagios (so it can die peacefully) is a wonderful opinionated talk on what the future of monitoring could look like. Although this talk was only given 18 months ago, Sensu has evolved a lot since then and several of the problems that were brought up in the talk have now been solved.
Kyle Andersons is a great contributor to the Sensu community and his talk on Sensu entitled Sensu @ Yelp (part 1, part 2) was the first Sensu talk I saw. It discusses how Sensu has been deployed at Yelp. The talk is a good starting point and explains Sensu and it’s dependencies from the ground up all the way through to customizing it to fit your companies specific needs, it really opened my eyes to the flexibility of Sensu and what is possible.
Recently I was asked to give a talk to the team leaders at my job about the work that I’ve been doing on our monitoring platform. The talk doesn’t focus solely on Sensu but is more generally about how we’ve improved the monitoring platform and with minimal effort from teams they could not only help Ops but improve Dev visibility or problems in production for themselves.
The talk slides (press ‘s’ for speakernotes) are available here.
How?
This section contains some resources to help gain a better understanding of Sensu.
The Sensu docs are constantly being updated, they are strong in places but also not so great in others:
- https://sensuapp.org/docs/latest
Kyle Anderson has done a cool free introductory course to Sensu in the form of video lectures:
- https://www.udemy.com/sensu-introduction/learn/
The renowned Sensu diagram from older versions of the docs and the current Sensu infrastructure gif are both confusing in my opinion. I made the following diagram which I find helps to describe the Sensu event pipeline:
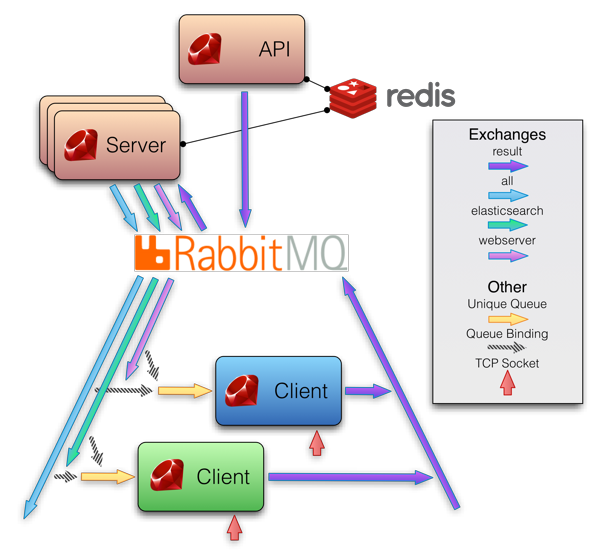
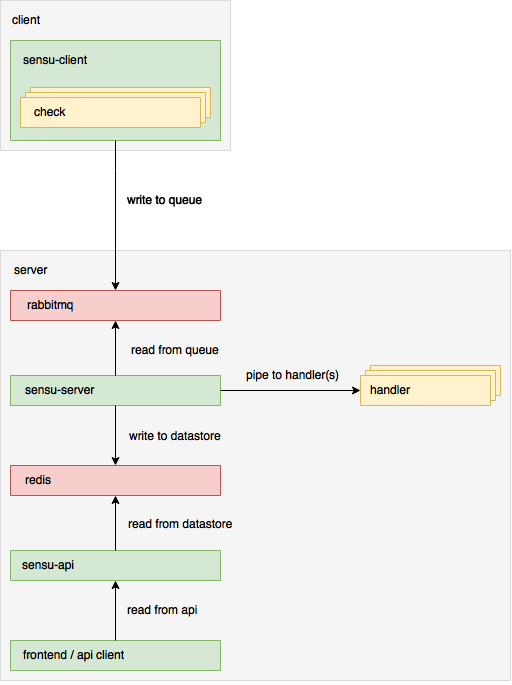
Note: this describes Sensu configured with Standalone checks only. If Subscription checks are used then the Sensu client reads from topics on RabbitMQ, too.
Sensu in Anger
Standalone Vs. Subscription Checks
One of the main points of confusion for a lot of people seems to be whether to choose subscription or standalone checks.
The difference between the two is that subscription checks are defined on the sensu-servers and then clients simply have a ‘subscriptions’ parameter with a list of subscriptions to subscribe to, where-as standalone checks are defined directly on each client.
For simplicity, and to follow what seems to be best practice, I tend to primarily use standalone checks. The Puppet and Chef modules by default assume that checks are defined as standalone checks, with subscription checks being the exception. I like that the configuration of standalone checks is on the client which makes things like debugging individual machines simpler.
Note: there is a
safe_modeparameter which can be set on clients when using subscription mode. The safe mode parameter is a security measure to prevent the Sensu client from executing a check scheduled by a Sensu server if a corresponding check definition doesn’t exist locally.
As far as I know standalone checks have two limitations:
Standlone checks can’t be used to create aggregate checks - i.e: when you want to check if a certain percentage of machines are in a certain state. The reason for this is that the way the data for aggregate checks is bucketed is by ‘issued’ time stamp. Subscription based checks all have the same timestamp since it’s read off the transport and is part of the event data in the response after the check has been run by the client. For standalone checks the issued timestamp is generated when the check is run and since each client schedules its own checks, the issued timestamps between clients wont match up.
Something to note when deciding to use subscription checks to create aggregate checks: since the bucket name for the aggregate check data is comprised of the issued timestamp and the check name, it isn’t possible to create aggregate checks with checks that have different check names. I did actually write a patch to solve this problem but because it involved a scheduler rewrite it was considered that the added complexity wasn’t worth supporting what was considered to be an edge case. As Sean Porter points out in the PR, the aggregate functionality may become more flexible in the future.
The second limitation is that round-robin checks can only be configured when using subscription checks, again this is because the Sensu server is used to schedule the checks rather than the clients, which have no common knowledge between them.
JIT Clients
I originally wrote about JIT clients in a previous post entitled Sensu - Host Masquerading, they have now been implemented and are a great way to monitor things like switches or any devices which can’t run a sensu-client natively.
RabbitMQ Issues
A lot of people initially have trouble configuring RabbitMQ.
- check the erlang version to make sure it is at least version R16B01 otherwise SSL won’t work
- get a Sensu client connecting to the RabbitMQ transport without SSL
- configure SSL
Enable RabbitMQ web UI:
rabbitmq-plugins enable rabbitmq_managementBrowse to http://server:15672
Also from the CLI:
# list clients connected to rabbitmq
rabbitmqctl list_connections -p /sensu
TTL and Timeouts
Configure your checks with timeouts and TTLs otherwise when a check config is removed and a client restarted, you won’t receive an alert.
Timeouts should be configured to kill long running check scripts and help avoid problems with check scripts running multiple times due to long execution times.
Debugging
Common pattern for debugging sensu-{client,server,api}:
# disable puppetruns; enable debugging, pipe logs through JQ
puppet agent --disable 'sensu debugging'
sed -i 's/warn/debug/' /etc/defaults/sensu
/etc/init.d/sensu-client restart
tail -f /var/log/sensu/sensu-client | jq .

# do some debugging..

# re-enable puppet; run puppet to reset client config state
puppet agent --enable
puppet agent -t
Deploying with Ansible (symlinks)
At my current job we manage everything up to application level with Puppet, and then use Ansible to deploy the applications. This is mainly because Ansible is much friendlier for developers to use and means we can delegate writing application deployment out to teams. Our applications are deployed under a single unprivileged user account with write access to a subdirectory under /etc/sensu: /etc/sensu/conf.d/checks/app. I added a patch to sensu to allow Sensu to read configuration files from symlinked directories, in this way application checks can be deployed as follows:
$ ls -l /etc/sensu/conf.d/checks/app
total 8
drwxrwxr-x 2 sensu   sensu     4096 Sep 14 17:08 .
dr-xr-xr-x 3 sensu   sensu     4096 Sep 14 12:54 ..
lrwxrwxrwx 1 company company   32   Sep 14 17:04 app_a-1 -> /home/company/opt/app_a-1/checks
lrwxrwxrwx 1 company company   41   Sep 14 17:05 app_b-1 -> /home/company/opt/app_b-1/checks
lrwxrwxrwx 1 company company   45   Sep  5 18:37 app_b-2 -> /home/company/opt/app_b-2/checks
Now when applications get removed from servers all that is left is a dangling symlink which puppet can then clean-up later.
Running Checks on a System
A common task tends to be logging in to a server to debug a check or to manually run a check to see if a problem has been fixed, to that end I wrote a prototype/primitive shell script that uses jq to extract the command from a check script and run it. At some point I’ll work more on this and add bash/zsh completion.
One of the nice reasons to have such a tool would be to allow developers to deploy Sensu check configurations into their development environments and still get an overview of the output from each check command without needing a running Sensu agent or Sensu cluster.
Multiple Slack Channels
I modified the original slack handler and added the ability to send alerts to multiple slack channels, the handler and further information can be found here
Embedding Interesting Data
Graphs / Graphite / Grafana
I wrote a blog post on embedding graphite graphs into Sensu using Ansible, since then I’ve switched to using much prettier (and interactive) grafana graphs deployed by Puppet, the same technique can be used as described in the original post.
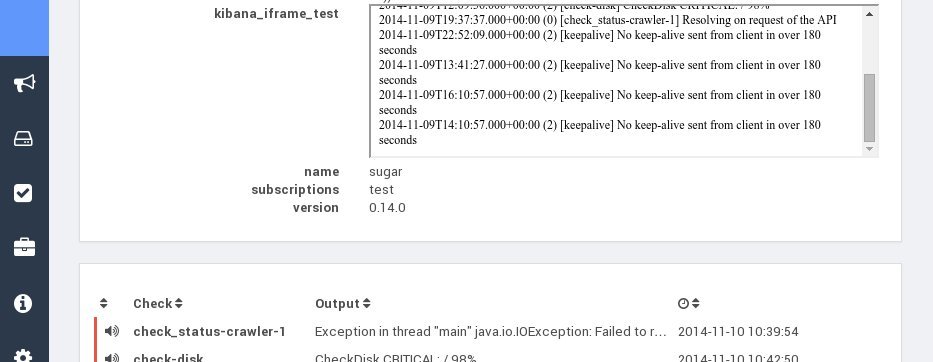
Event History / Logging
Sensu maintains the last 21 states of each currently active check to use for things like flap detection. Sensu doesn’t have a full event history but in keeping with the unix philosophy, there is a logstash handler which allows you to write event history to logstash. Kibana can then be used to view event history.
I wrote a patch that is now part of Uchiwa which allows embedding iFrames into Sensu metadata.
Here is another prototype app I wrote that acts as a proxy between Uchiwa and Elasticsearch containing Logstash data. The proxy returns an Iframe that can be embedded in Uchiwa.
I would like to prettify the log output at some point.
Moving from Nagios
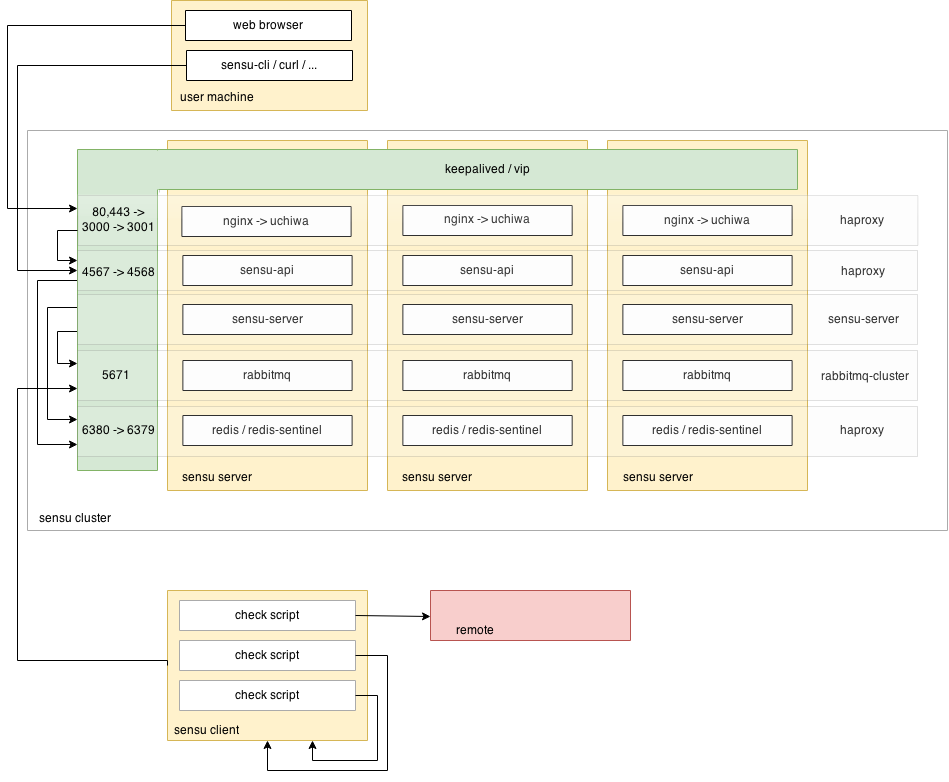
HA
Inevitably after deciding to use Sensu in production, you’ll want to look at running Sensu in a HA configuration, here’s a diagram describing my configuration:
How Many Checks?
Some bash to calculate how many checks are running on your infrastructure..
mbp0 /home/rw > cat tmp/sensu_overview.sh
#!/usr/bin/env bash
#
# Script to output some statistics about a Sensu deployment
#
# Notes:
#
# * requires jq (https://stedolan.github.io/jq/)
# * slow
#

SERVER=$1

function number_of_checks () {
  checks=0

  for client in $(sensu-cli client list -f json | jq -r '.[].name'); do
    client_checks=$(curl -s ${SERVER}:4567/clients/${client}/history | jq '. | length')
    checks=$((${checks}+${client_checks}))
  done

  echo $checks
}

function number_of_clients () {
  curl -s ${SERVER}:4567/clients | jq '. | length'
}

echo "number of clients: $(number_of_clients)"
echo "number of checks:  $(number_of_checks)"
mbp0 /home/rw > ./tmp/sensu_overview.sh sensu.xxx.net
number of clients: 429
number of checks: 11481Other Contributions..
I wrote the initial implementation of the result data storage which essentially allows green-light-esque dashboards, i.e: the ability to see metadata and output value from checks with status-0. This was the groundwork which allowed for TTL feature to be implemented.
Conclusion
Sensu is great. It’s a really flexible, easily customizable platform that can be integrated into just about anything. I’ve had fun contributing back to the community and look forward to seeing the new and interesting ways people come up with using Sensu.