Earlier this year I saw a great talk entitled Please stop using Nagios (so it can die peacefully). After I’d finished laughing and picked myself up off the floor, I deployed Sensu and immediately loved it.
Months later and I’m now experimenting with replacing the existing nagios monitoring system we use at my new job with Sensu.
Uchiwa
One of the things I thought would be useful would be to have graphs embedded in the wonderful Uchiwa dashboard. It turns out I’m not alone because the author of Uchiwa (Simon Palourde) has plans to add support for embedding graphite graphs into Uchiwa natively. Until then, it’s still possible to get some lovely graph action going on by taking advantage of the fact Uchiwa will:
- display any extra properties you add to the client config JSON or check config JSON in the UI
- render images
Uchiwa decides what to display as an image depending on file extension type. Adding a fake argument to our graphite query tricks Uchiwa into displaying the image returned by the query inline, instead of as a link to the graph:
&uchiwa_force_display_as_image=.jpgGraphite
I want to be able to see CPU and Memory usage for each machine when I click on the machine view. My graphite queries look like:
https://graphite.brandwatch.com/render \
  ?from=-12hours \
  &until=now \
  &width=500 \
  &height=200 \
  &target=collectd.<hostname>.aggregation-cpu-average.cpu-system.value

https://graphite.brandwatch.com/render \
  ?from=-12hours \
  &until=now \
  &width=500 \
  &height=200 \
  &target=collectd.<hostname>.memory.memory-used.value \
  &target=collectd.<hostname>.memory.memory-cached.value \
  &target=collectd.<hostname>.memory.memory-free.value \
  &target=collectd.<hostname>.memory.memory-buffered.value
Putting it Together..
Add the queries to the client config. It’s necessary to encode the single quotes (%27) and since I’m using Ansible to distribute the Sensu configuration, I’ve used {{ ansible_hostname }} in place of the hostname in each metric key.
{
   "client": {
      "name": "{{ sensu_client_hostname }}",
      "address": "{{ sensu_client_address }}",
      "subscriptions": subscriptions,
      "graphite_cpu": "https://graphite.brandwatch.com/render?from=-12hours&until=now&width=500&height=200&target=collectd.{{ ansible_hostname }}.aggregation-cpu-average.cpu-system.value&uchiwa_force_image=.jpg",
      "graphite_mem": "https://graphite.brandwatch.com/render?from=-12hours&until=now&width=500&height=200&target=collectd.{{ ansible_hostname }}.memory.memory-used.value&target=collectd.{{ ansible_hostname }}.memory.memory-cached.value&target=collectd.{{ ansible_hostname }}.memory.memory-free.value&target=collectd.{{ ansible_hostname }}.memory.memory-buffered.value&uchiwa_force_image=.jpg"
   }
}
The Result
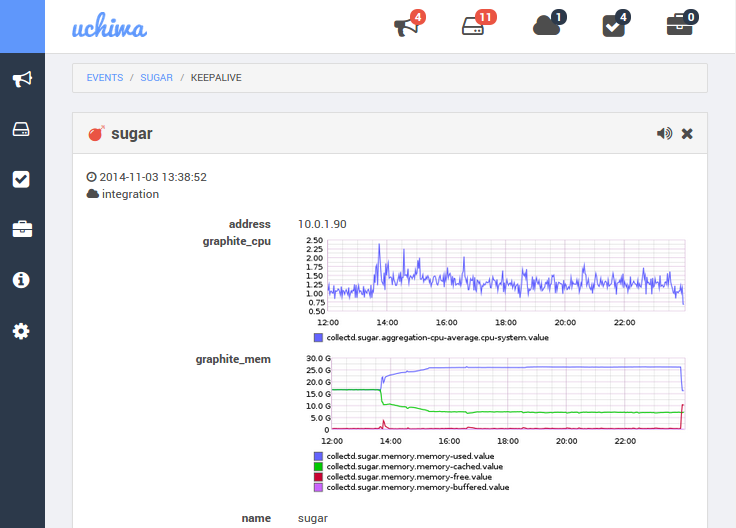
Going Further..
Checks can also have arbitrary properties so it’s also possible to add queries to the check definitions and have them appear in the check view of Uchiwa.