Graphite Events
I learnt from jdixons obfuscurity blog that Graphite has a little known feature called Events that can, unsurprisingly, be used to store events in Graphite.
Since Sensu/Uchiwa don’t have any way to see event history, I thought it would be nice to be able to see check events on related graphs, for example: CPU {WARN,CRIT,OK} on the CPU usage graph.
In order to pipe Sensu events into Graphite, I wrote a simple handler plugin that POSTs all Sensu events to the Graphite Events URI.
The following is a short write-up of how to get going with Sensu events and Graphite.
Writing Events
First, test to see if it’s possible to write to the Graphite Events URI. Unlike writing data to carbon, the Events URI expects json:
curl --insecure \
-X POST \
https://graphite.brandwatch.com:443/events/ \
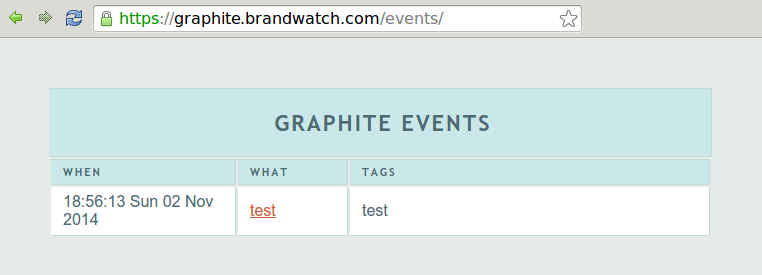
-d '{"what": "test", "tags" : "test"}'Reading Events
The event should appear in the Graphite event list:
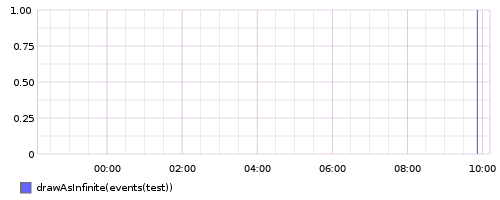
Next, test to see if the event is retrievable:
curl "https://graphite.brandwatch.com/render \
  ?from=-12hours \
  &until=now \
  &width=500 \
  &height=200 \
  &target=drawAsInfinite(events('test'))"
Note: Since the event has no Y value, drawAsInfinite() is used to extend the X value (time) vertically so that the event is displayed as a vertical bar on the graph:
Sensu
Now to get Sensu check events into Graphite.
Handler
Install the handler (update: now available as part of the sensu-community-plugins: handler and config) on your Sensu server, adjusting the graphite_event.json config if necessary:
git clone \
  https://github.com/roobert/sensu_handler_graphite_event.git

cp sensu_handler_graphite_event/graphite_event.json \
  /etc/sensu/conf.d/

cp sensu_handler_graphite_event/graphite_event.rb \
  /etc/sensu/handlers/

sudo service sensu-server restart
Events
In my last post, I talked about how to embed Graphite graphs in the Uchiwa UI and used a CPU Graphite query as an example. This is the same query except that I’ve added the events targets:
curl "https://graphite.brandwatch.com/render \
  ?from=-12hours \
  &until=now \
  &width=500 \
  &height=200 \
  &target=collectd.<hostname>.aggregation-cpu-average.cpu-system.value \
  &target=drawAsInfinite(events('sugar', 'check-cpu', 'ok')) \
  &target=drawAsInfinite(events('sugar', 'check-cpu', 'warning')) \
  &target=drawAsInfinite(events('sugar', 'check-cpu', 'critical'))"
Here’s the result of the above query, displaying two events at about 6pm. Note that the graph time period is such that the CRITICAL and OK events are practically overlapping:
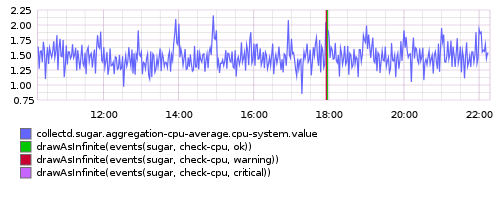
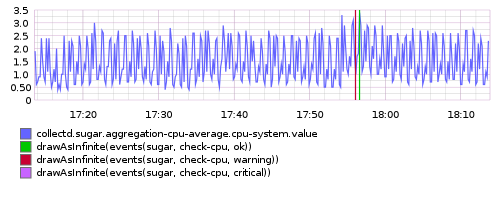
Here are the same two events displayed on a graph with a much lower query window (1 hour):
Uchiwa
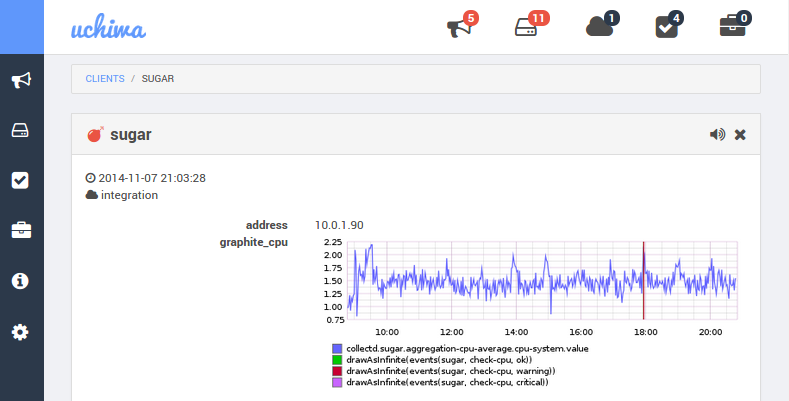
Finally, update the Sensu client.json with the new query:
{
   "client": {
      "name": "{{ sensu_client_hostname }}",
      "address": "{{ sensu_client_address }}",
      "subscriptions": subscriptions,
      "graphite_cpu": "https://graphite.brandwatch.com/render?from=-12hours&until=now&width=500&height=200&target=collectd.{{ ansible_hostname }}.aggregation-cpu-average.cpu-system.value&target=drawAsInfinite(events(%27{{ ansible_hostname }}%27,%27check-cpu%27,%27ok%27))&target=drawAsInfinite(events(%27{{ ansible_hostname }}%27,%27check-cpu%27,%27warning%27))&target=drawAsInfinite(events(%27{{ ansible_hostname }}%27,%27check-cpu%27,%27critical%27))&uchiwa_force_image=.jpg"
   }
}
Result:
Going Further..
It’s useful having CPU/Mem graphs visible in the client view of Uchiwa, but it’s equally possible to include graphs in a check definition so they are visible in the check view.
Creating an events() target with ‘keepalive’ as one of the tags will allow you to see changes in the overall client availability.
Next..
Next up: embedding Logstash/Kibana data in Uchiwa.