Abstract
Grafana has recently released Grafana Loki, a horizontally-scalable, highly-available, multi-tenant log aggregation system inspired by Prometheus. This is great for container based systems where scraping application logs from log files is possible, however, in AWS the standard for many services is to write logs to Cloudwatch. In order to get logs from Cloudwatch into Loki I’ve written a Lambda function which can be found here: https://github.com/roobert/cloudwatch-loki-shipper
Cloudwatch-Loki-Shipper
A Cloudwatch subscription filter is used to trigger the Lambda on new events, logs are processed and then pushed to the Loki API.
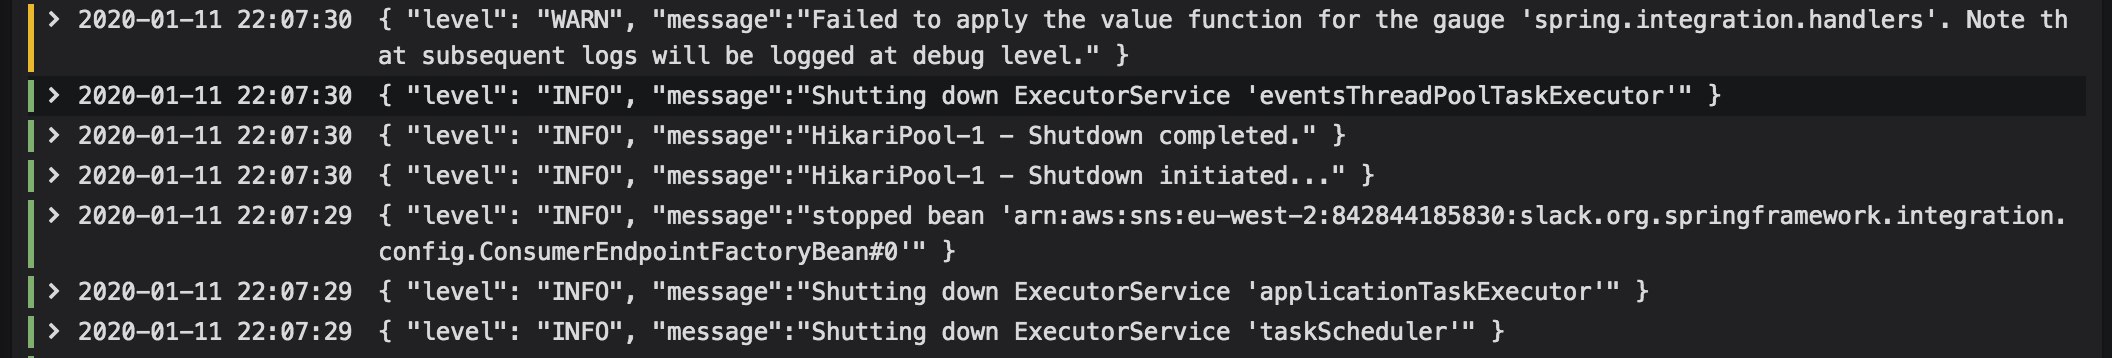
The Lambda function can operate in two ways, either it can pass through raw log messages as-is, which can look something like this:
Non-formatted JSON log:
Optionally, it can be configured to do some intermediate processing using the following environment variables:
LOG_LABELS             = "classname,logger_name"
LOG_TEMPLATE           = "level=$level | $message"
LOG_TEMPLATE_VARIABLES = "level,message"
LOG_IGNORE_NON_JSON    = "true"
This config will tell the Lambda to load incoming message as a JSON object, it’ll then do the following:
- Lookup values for each key in LOG_LABELS and for each key that exists, set the corresponding value as a label for the log entry
- Format the message using the template defined with LOG_TEMPLATE_VARIABLES. Corresponding variable names are specified with LOG_TEMPLATE_VARIABLES for the variable substitution
- Drop any messages that are not in JSON format. This is useful when badly behaved applications can output non-JSON log messages
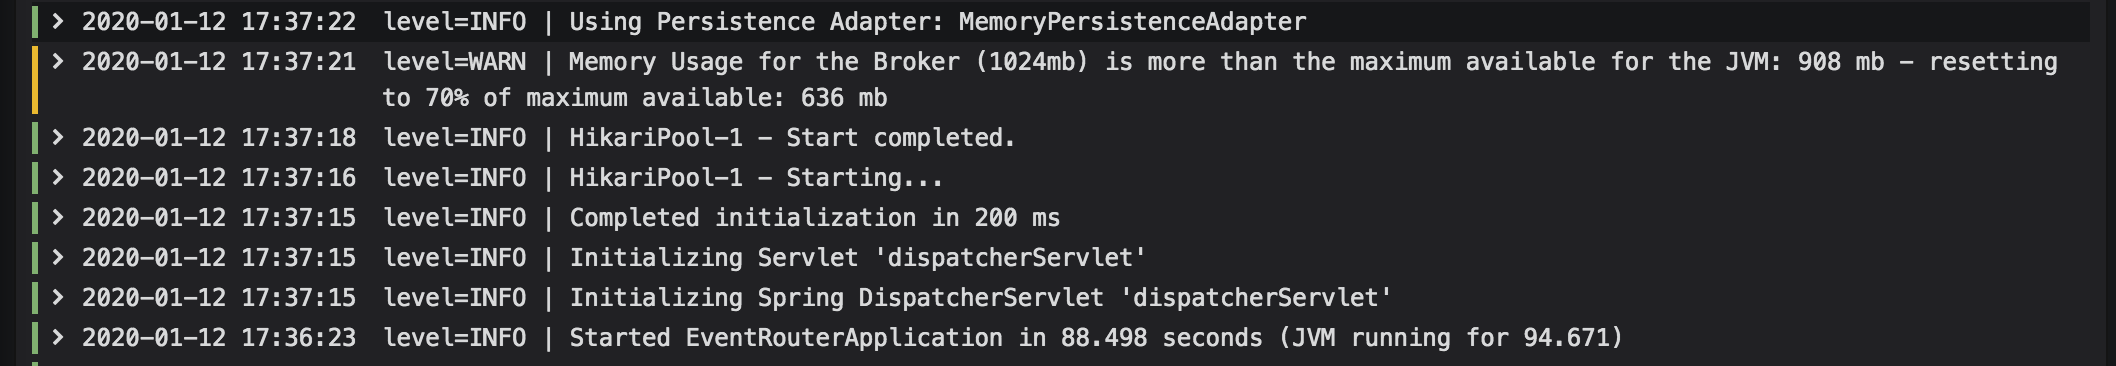
Log templating can be used to customize the log string into any format. By default when viewing logs Grafana will attempt to establish the log level by looking for either level=<log level> or "level":"<log level>" in the log string, or by checking the log label level. It will then colour the log line depending on corresponding log level. Unfortunately at the moment there is a bug in Grafana that prevents the log label being used to colour the log lines and so it’s necessary to keep the level key/value in the log line. I’ve settled on the format level=<log level> | <log message> as shown in the previously mentioned environment variables. The result is as follows:
Deployment
It’s possible to use the included Terraform to deploy the function: https://github.com/roobert/cloudwatch-loki-shipper/blob/master/terraform/cloudwatch-loki-shipper.tf
Querying Loki using LogCLI
Query logs from the Loki API using LogQL:
logcli --addr=http://metrics.example.com:3100 \
  query --tail --no-labels '{logGroup="/app/events-router/events-router"}' \
  | cut -d\  -f2- | jq -rc '"\(.["@timestamp"]) \(.level) \(.message)"'
LogQL docs: https://github.com/grafana/loki/blob/master/docs/logql.md
Alerting
An example query that could be used for alerting:
logcli --addr=http://metrics.example.com:3100 query 'count_over_time({level="WARN"}[5m])'
A check script for alerting can be found here: https://github.com/roobert/sensu-plugins-loki/
Example deployment:
wget https://github.com/grafana/loki/releases/download/v1.2.0/logcli-linux-amd64.zip
unzip logcli-linux-amd64.zip
mv -v logcli-linux-amd64 /usr/local/bin/logcli

sensuctl asset create debian-sensu-plugins-loki \
  --url https://github.com/roobert/sensu-plugins-loki/releases/download/0.0.14/sensu-plugins-loki_0.0.14_debian_linux_amd64.tar.gz \
  --sha512 32ce56dd3742a52a70b71f8aa822cbefa5dfbb960c042bd155cc001321476e0cd0ec112420ec1638d66e7c8c5b5f3ff7cd2cb1219afaedcdfac2874f12016965

sensuctl check create events-router-logs-error \
  --command "check-loki-logcli.rb --addr=http://metrics.example.com:3100 --query 'count_over_time({logGroup=\"/app\", level=\"ERROR\"}[1m])'" \
  --interval 60 \
  --subscriptions sensu \
  --handlers slack \
  --runtime-assets debian-sensu-plugins-loki,debian-sensu-ruby-runtime
Conclusion
Loki providers a nice lightweight alternative to a full ELK stack and is great if full text search is not a requirement. Simpler to deploy and manage, yet still flexible enough to be used to gain visibility of issues and as a source for alerting.
References
Inspired by: https://github.com/ClaudioWaldvogel/cloudwatch-loki-shipper/