Problem
At my current job, we use Google Cloud Platform. Each team has a set of GCP Projects; each project can have multiple clusters. The majority of services that our teams write expose some kind of HTTP API or web interface - so what does this mean? All HTTP endpoints we expose are encrypted with SSL[1], so we have a lot of SSL certificates in a lot of different places.
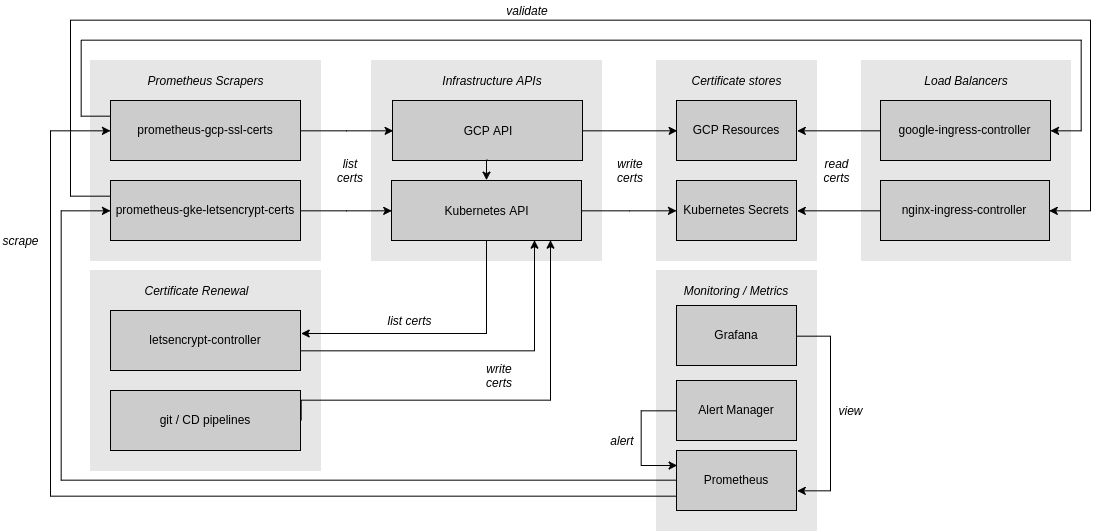
Each of our GCP projects is built using our CI/CD tooling. All GCP resources and all of our Kubernetes application manifests are defined in git. We have a standard set of stacks that we deploy to each cluster using our templating. One of the stacks is Prometheus, Influxdb, and Grafana. In this article, I’ll explain how we leverage (part of) this stack to automatically monitor SSL certificates in use by our load balancers across all of our GCP projects.
Certificate Renewal
To enable teams to expose services with minimal effort, we rely on deploying a Kubernetes LetsEncrypt controller to each of our clusters. The LetsEncrypt controller automatically provisions certificates for Kubernetes resources that require them, as indicated by annotations on the resources, e.g:
apiVersion: v1
kind: Service
metadata:
  name: app0
  labels:
    app: app0
  annotations:
    acme/certificate: app0.prod.gcp0.example.com
    acme/secretName: app0-certificate
spec:
  type: ClusterIP
  ports:
    - port: 3000
      targetPort: 3000
  selector:
    app: app0
This certificate can now be consumed by an NGiNX ingress controller, like so:
apiVersion: extensions/v1beta1
kind: Ingress
metadata:
  name: app0
  annotations:
    kubernetes.io/ingress.class: "nginx"
spec:
  tls:
    - secretName: app0-certificate
      hosts:
        - app0.prod.gcp0.example.com

  rules:
    - host: app0.prod.gcp0.example.com
      http:
        paths:
          - path: /
            backend:
              serviceName: app0
              servicePort: 3000
Switching the ingress.class annotation to have the value of gce will mean Google Compute Engine will handle this configuration. A copy of the secret (the SSL certificate) will be made in GCP as a Compute SSL Certificate resource, which the GCP load balancer can then use to serve HTTPS.
Of course, this isn’t the only method for deploying SSL certificates for services in GCP and/or Kubernetes. In our case, we also have many legacy certificates that are manually renewed by humans, stored encrypted in our repositories, and deployed as secrets to Kubernetes or SSL Certificate resources to Google Compute Engine.
The GCE ingress controller makes a copy of the secret as a Compute SSL Certificate. This means that certificates used in the default Kubernetes load balancers are stored in two separate locations: the Kubernetes cluster, as a secret, and in GCE, as a Certificate resource.
Regardless of how the certificates end up in either GCE or Kubernetes, we can monitor them with Prometheus.
Whether manually renewed or managed by LetsEncrypt, our certificates end up in up-to two places:
- The Kubernetes Secret store
- As a GCP compute SSL Certificate
Note that the NGiNX ingress controller works by mounting the Kubernetes Secret into the controller as a file.
The following commands will show certificates for each respective location:
- Kubernetes Secrets (
kubectl get secret) - GCP compute ssl-certificates (
gcloud compute ssl-certificates)
Exposing Certificate Expiry
In order to ensure that our certificates are being renewed properly, we want to check the certificates that are being served up by the load balancers. To check the certificates we need to do the following:
- Fetch a list of FQDNs to check from the appropriate API (GCP or GKE/Kubernetes)
- Connect to each FQDN and retrieve the certificate
- Check the Valid To field for the certificate to ensure it isn’t in the past
To do the first two parts of this process we’ll use a couple of programs that I’ve written that scrape the GCP and K8S APIs and expose the expiry times for every certificate in each:
Kubernetes manifest for prometheus-gke-letsencrypt-certs:
apiVersion: extensions/v1beta1
kind: Deployment
metadata:
  name: prometheus-gke-letsencrypt-certs
  namespace: system-monitoring
  labels:
    k8s-app: prometheus-gke-letsencrypt-certs
spec:
  replicas: 1
  selector:
    matchLabels:
      k8s-app: prometheus-gke-letsencrypt-certs
  template:
    metadata:
      labels:
        k8s-app: prometheus-gke-letsencrypt-certs
      annotations:
        prometheus_io_port: '9292'
        prometheus_io_scrape_metricz: 'true'
    spec:
      containers:
      - name: prometheus-gke-letsencrypt-certs
        image: roobert/prometheus-gke-letsencrypt-certs:v0.0.4
        ports:
          - containerPort: 9292
Kubernetes manifest for prometheus-gcp-ssl-certs:
apiVersion: extensions/v1beta1
kind: Deployment
metadata:
  name: prometheus-gcp-ssl-certs
  namespace: system-monitoring
  labels:
    k8s-app: prometheus-gcp-ssl-certs
spec:
  replicas: 1
  selector:
    matchLabels:
      k8s-app: prometheus-gcp-ssl-certs
  template:
    metadata:
      labels:
        k8s-app: prometheus-gcp-ssl-certs
      annotations:
        prometheus_io_port: '9292'
        prometheus_io_scrape_metricz: 'true'
    spec:
      containers:
      - name: prometheus-gcp-ssl-certs
        image: roobert/prometheus-gcp-ssl-certs:v0.0.4
        ports:
          - containerPort: 9292
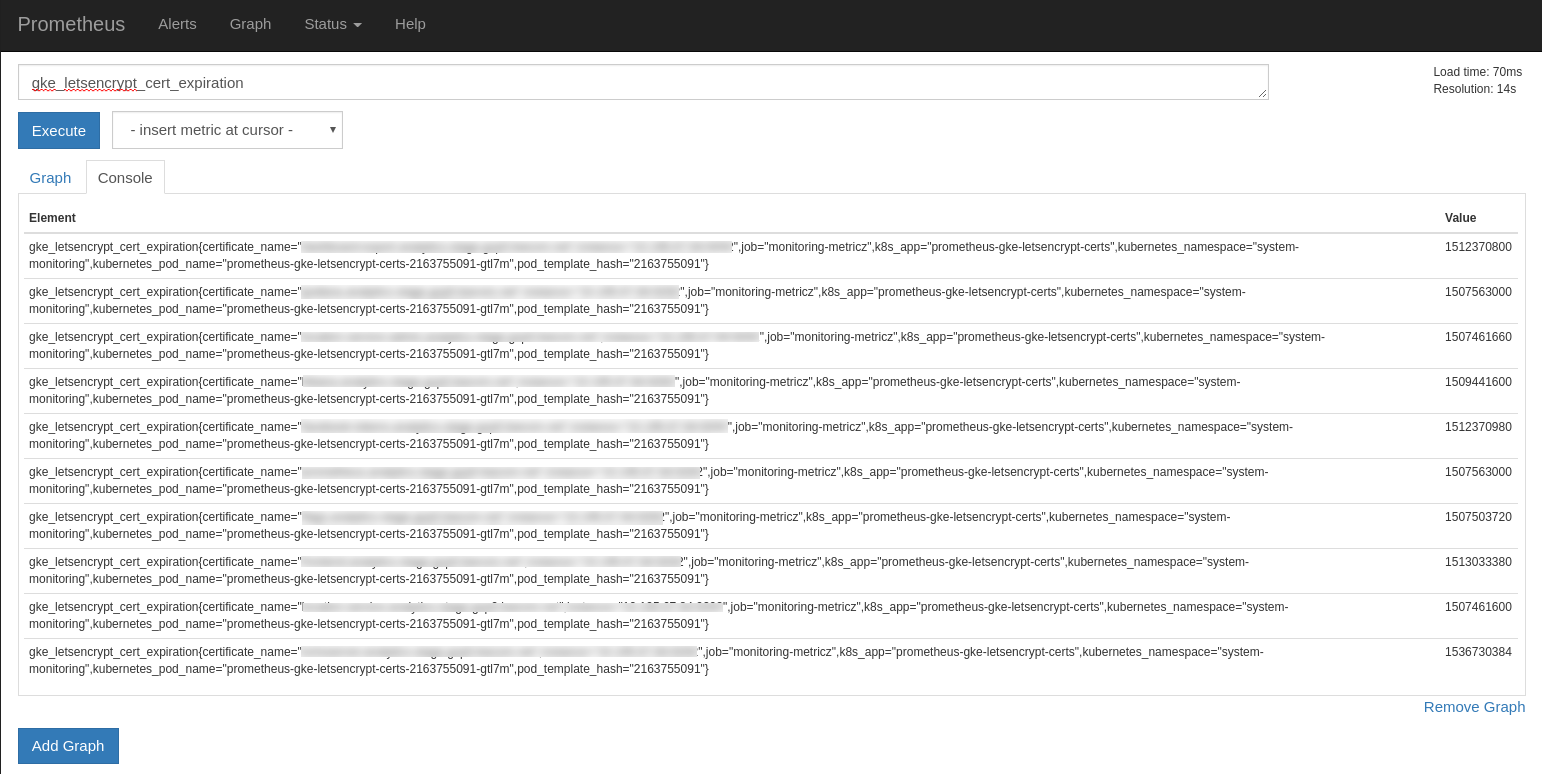
These exporters each connect to a different API and then expose a list of CNs with their Valid To value in seconds. Using these values we can calculate how long left until the certificate expires (time() - $valid_to).
Once these exporters have been deployed, and if, like ours, Prometheus has been configured to look for the prometheus_io_* annotations, then Prometheus should start scraping these exporters and the metrics should be visible in the Prometheus UI. Search for gke_letsencrypt_cert_expiration or gcp_ssl_cert_expiration, here’s one example:

Visibility
Now that certificate metrics are being updated, the first useful thing we can do is make them visible.
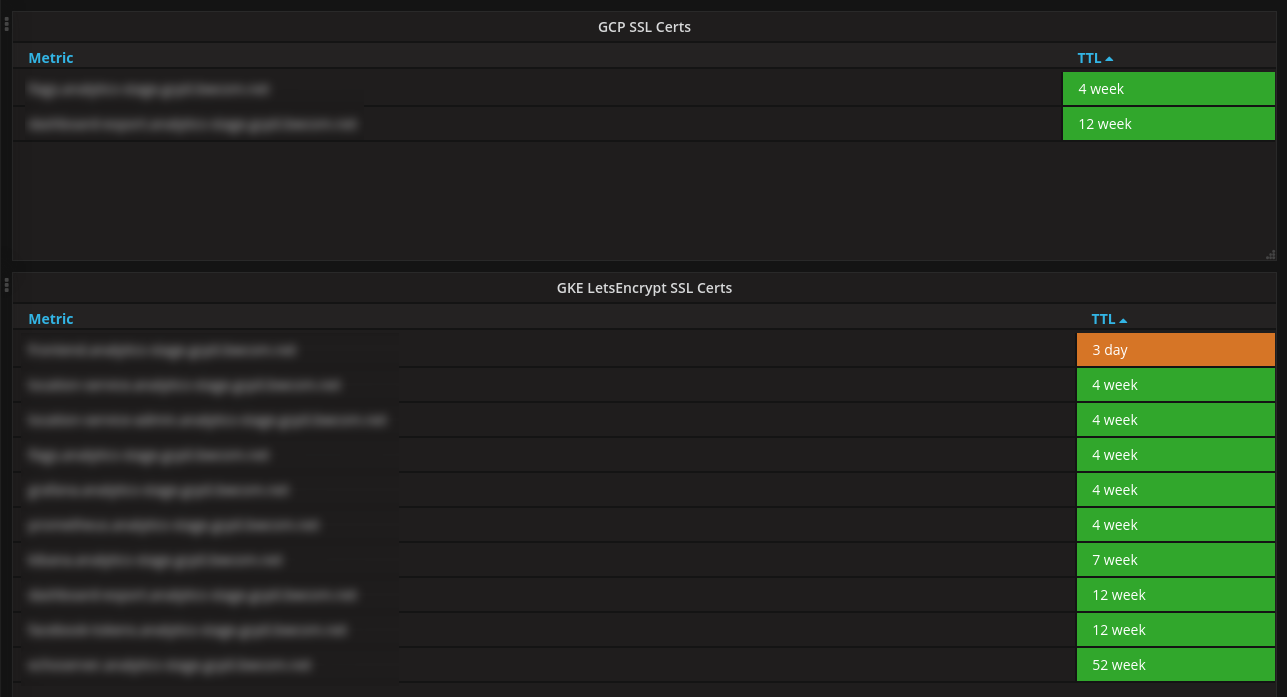
Each of our projects has a Grafana instance automatically deployed to it and preloaded with some useful dashboards, one of which queries Prometheus for data about the SSL certs. When a certificate has less than seven days until it runs out, it turns orange; when it’s expired it will turn red.

The JSON for the above dashboard can be found in this gist: gist:roobert/e114b4420f2be3988d61876f47cc35ae
Alerting
Next, let’s setup some Alert Manager alerts so we can surface issues rather than having to check for them ourselves:
ALERT GKELetsEncryptCertExpiry
  IF gke_letsencrypt_cert_expiry - time() < 86400 AND gke_letsencrypt_cert_expiry - time() > 0
  LABELS {
    severity="warning"
  }
  ANNOTATIONS {
    SUMMARY = ": SSL cert expiry",
    DESCRIPTION = ": GKE LetsEncrypt cert expires in less than 1 day"
  }

ALERT GKELetsEncryptCertExpired
  IF gke_letsencrypt_cert_expiry - time() =< 0
  LABELS {
    severity="critical"
  }
  ANNOTATIONS {
    SUMMARY = ": SSL cert expired",
    DESCRIPTION = ": GKE LetsEncrypt cert has expired"
  }

ALERT GCPSSLCertExpiry
  IF gcp_ssl_cert_expiry - time() < 86400 AND gcp_ssl_cert_expiry - time() > 0
  LABELS {
    severity="warning"
  }
  ANNOTATIONS {
    SUMMARY = ": SSL cert expiry",
    DESCRIPTION = ": GCP SSL cert expires in less than 1 day"
  }

ALERT GCPSSLCertExpired
  IF gcp_ssl_cert_expiry - time() =< 0
  LABELS {
    severity="critical"
  }
  ANNOTATIONS {
    SUMMARY = ": SSL cert expired",
    DESCRIPTION = ": GCP SSL cert has expired"
  }
Caution: The window of opportunity for receiving warnings before cert expiry is extremely slim because The LetsEncrypt controller renewal window happens within 1-2 days of expiry.
Conclusion
In this article, I’ve outlined our basic SSL monitoring strategy and included the code for two Prometheus exporters which can expose the metrics necessary to configure your own graphs and alerts. I hope this has been helpful.
[1] Technically TLS but commonly referred to as SSL